2D CFD analysis
This example shows you how to conduct a 2D fluid dynamics analysis. CFD module use Su2 as the default solver.
Selecting units
In the beginning, we select the MMKS unit system for the subsequential simulation. Clicking Preferences from the Toolbar or Menu, and setting the Metric (kg, mm, s, mA, N, mV). 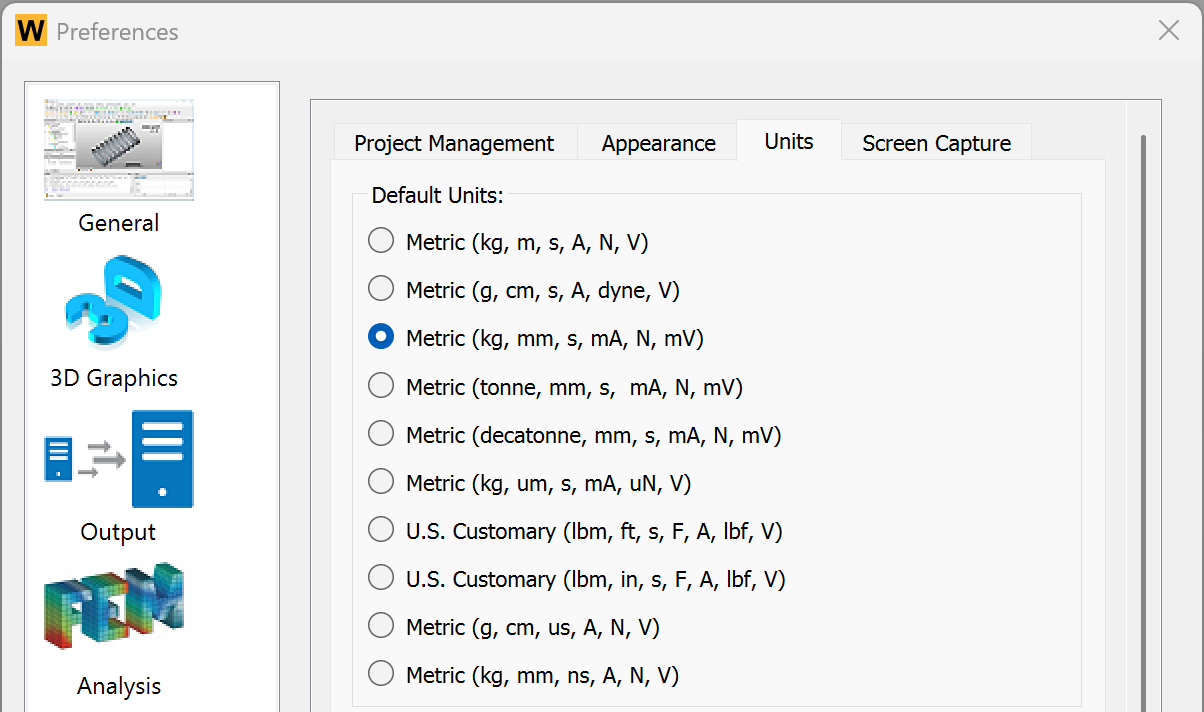
Specifying analysis
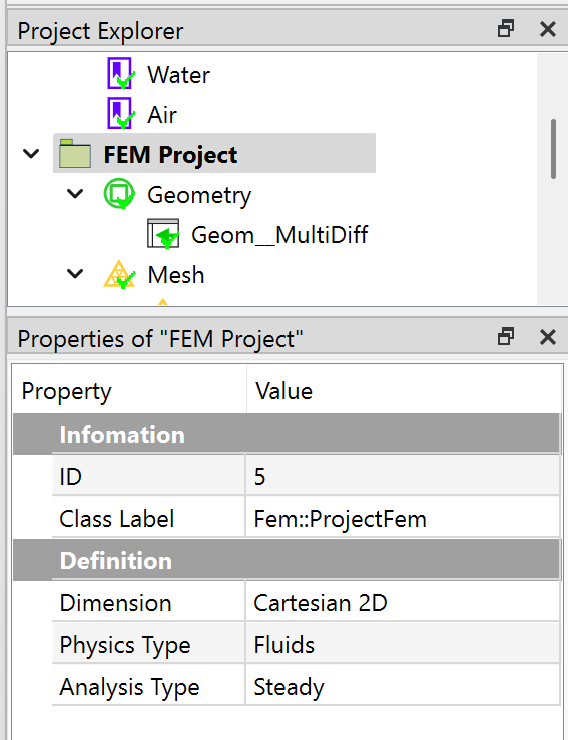
In the Properties View of the FEM Project object, you set the Dimension to Cartesian 2D, Physics Type property to Fluids, and Analysis Type to Steady. A 2D CFD analysis is defined as shown in Figure below.
Preparing geometry
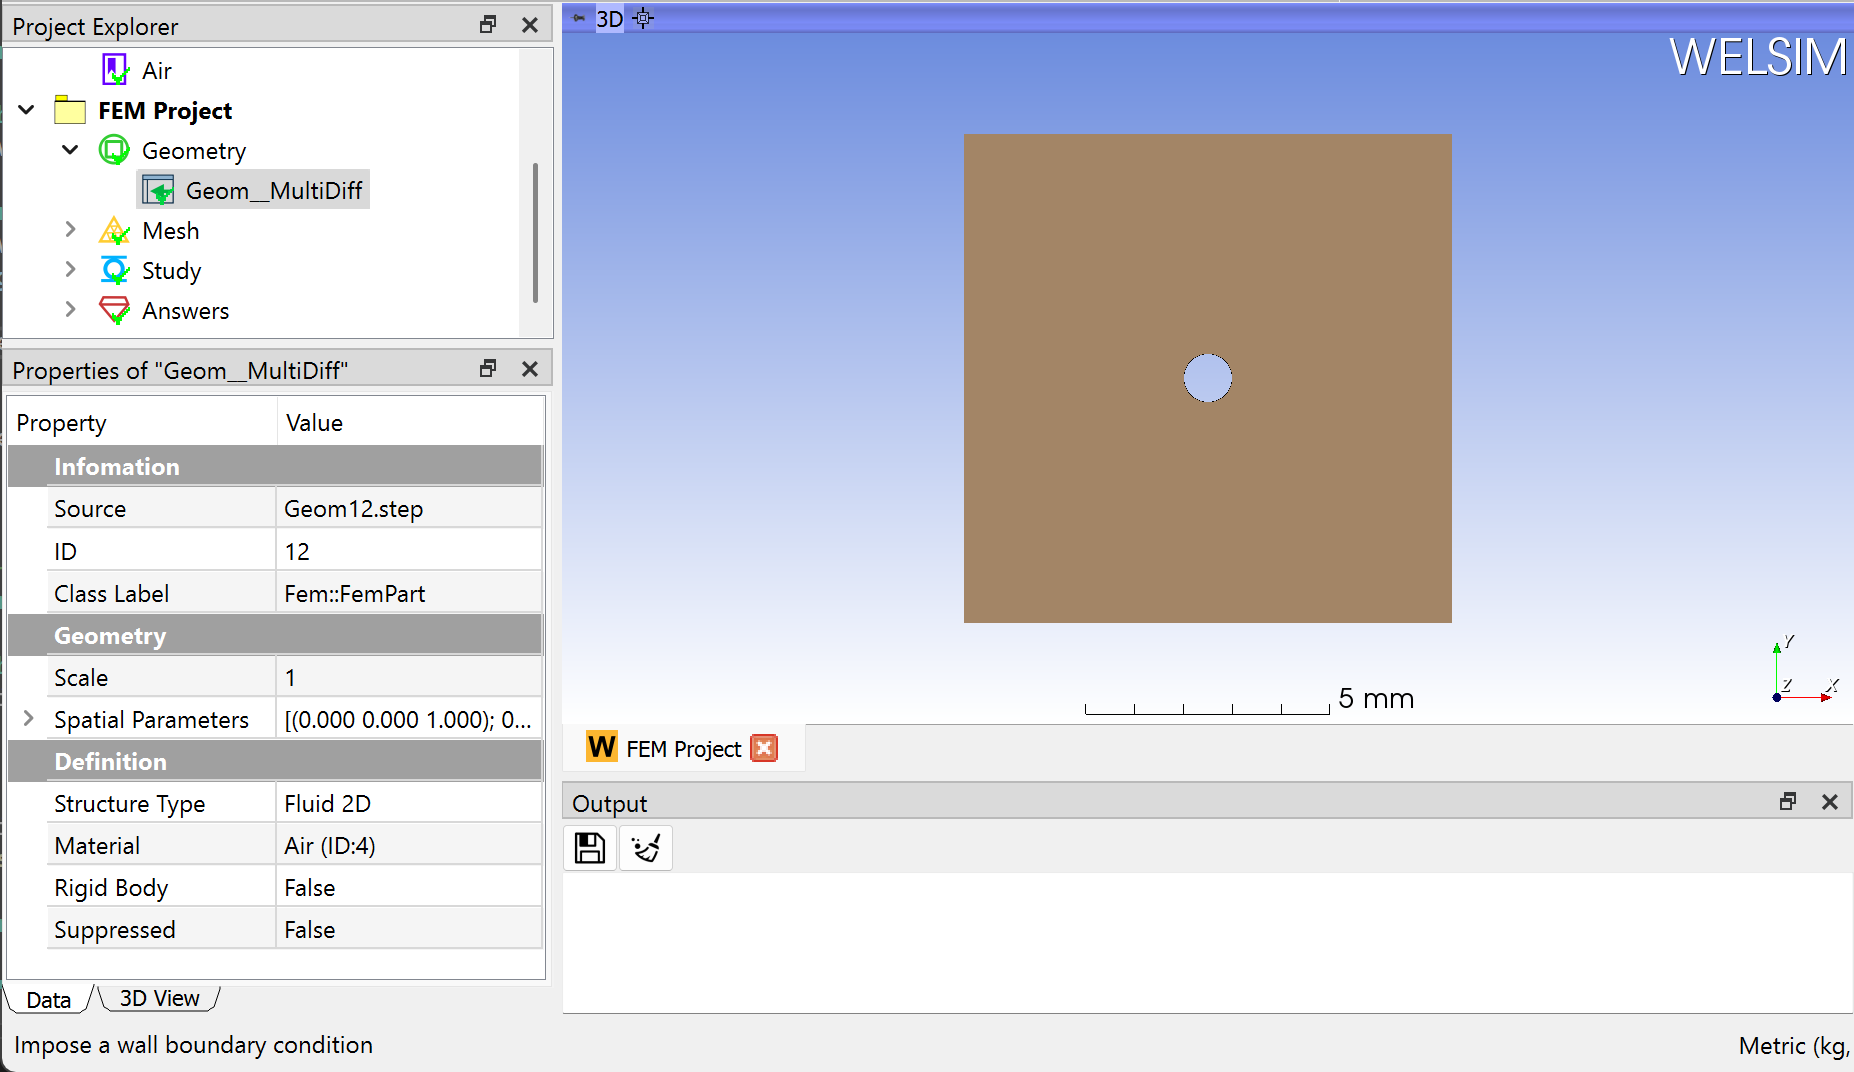
Next, you can import the geometry file “hole_plate_2d.step” by clicking the Import... command from the Toolbar or Geometry Menu. The imported geometry and material property are shown in Figure below.
Setting mesh
To obtain a fine mesh for the analysis, you set the Mesh Settings properties Maximum Size to 0.3 mm.
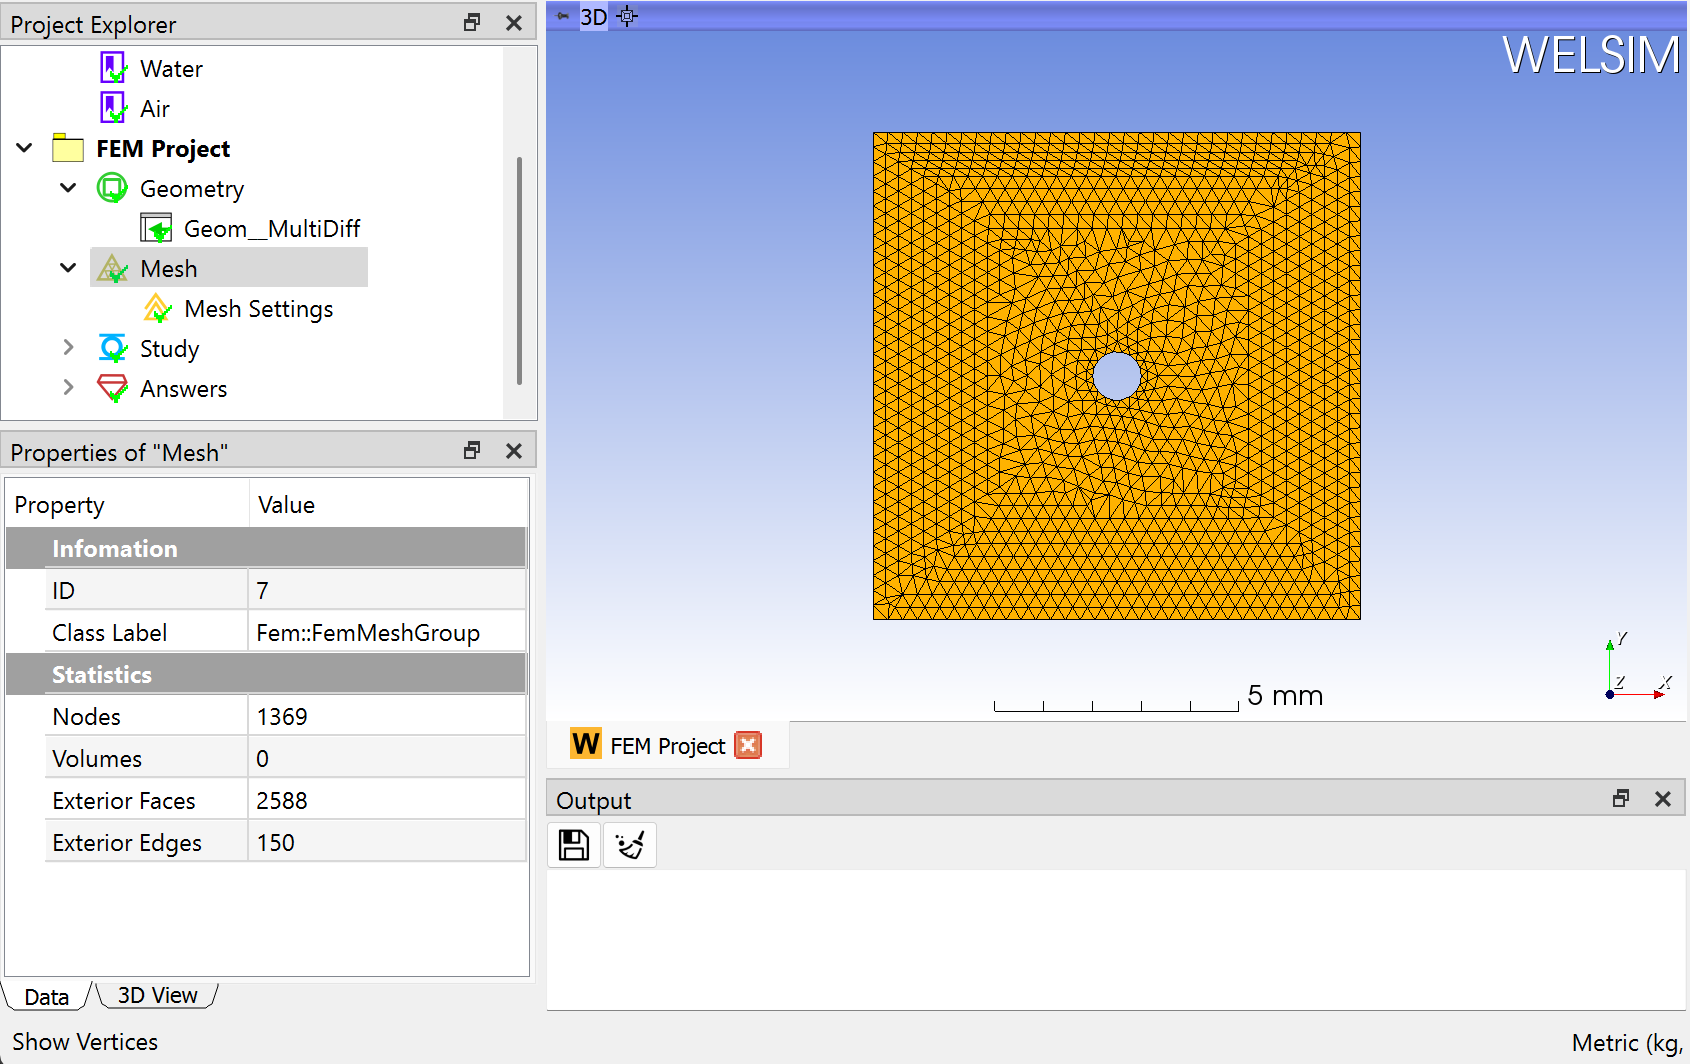
Clicking the Mesh command from the Toolbar or FEM Menu, you can mesh the geometries. There are 1369 nodes, and 2588 Tri3 elements generated as shown in Figure below.
Setting anlaysis
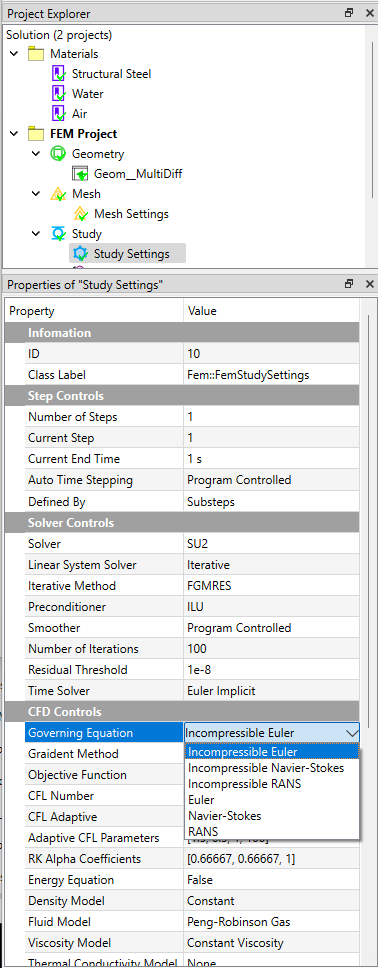
Clicking the Study Setting object and setting the CFD analysis conditions. In this example, Incompressible Euler governing equation is applied. Since SU2 is the default CFD solver, these settings are consistent with the SU2 input script settings. For more details, please refer to the manual of SU2.
Imposing conditions
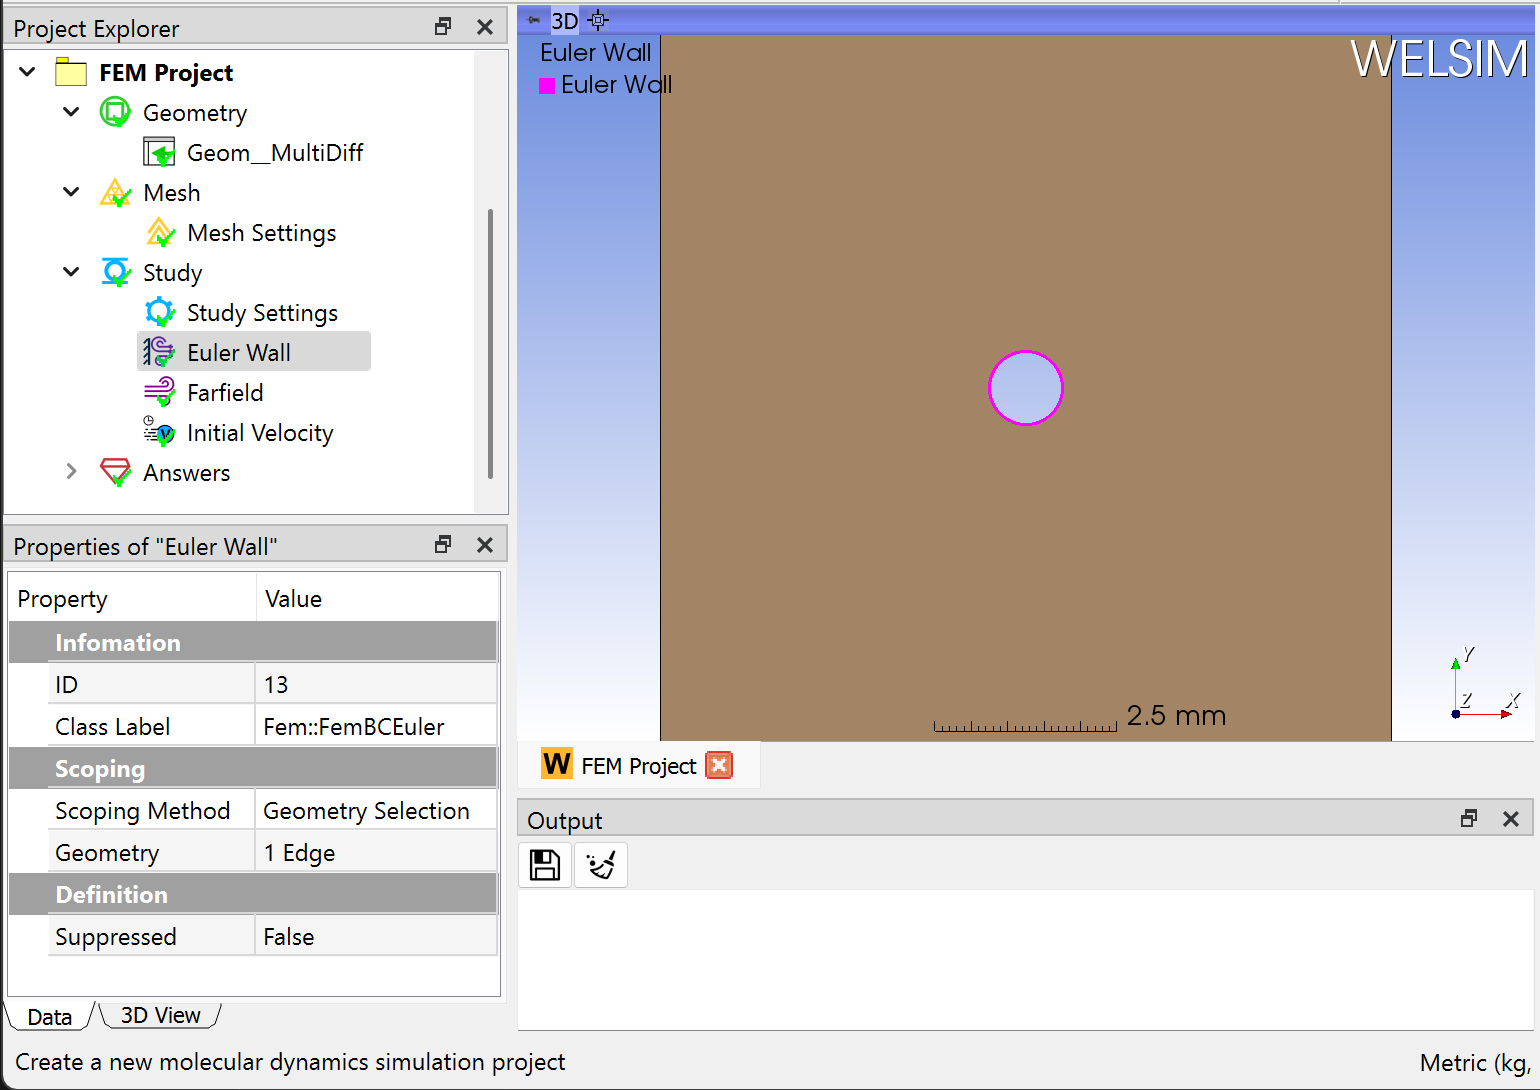
Next, you impose two boundary conditions, a Euler Wall, and Farfield by clicking the corresponding commands from the Toolbar and Fluids Menu. The inner circular edge is selected for the Wall boundary condition, and outer edges are selected for the farfield, you can hold the Ctrl or Shift key to select multiple edges. The wall boundary condition is configured as shown in the figure below.
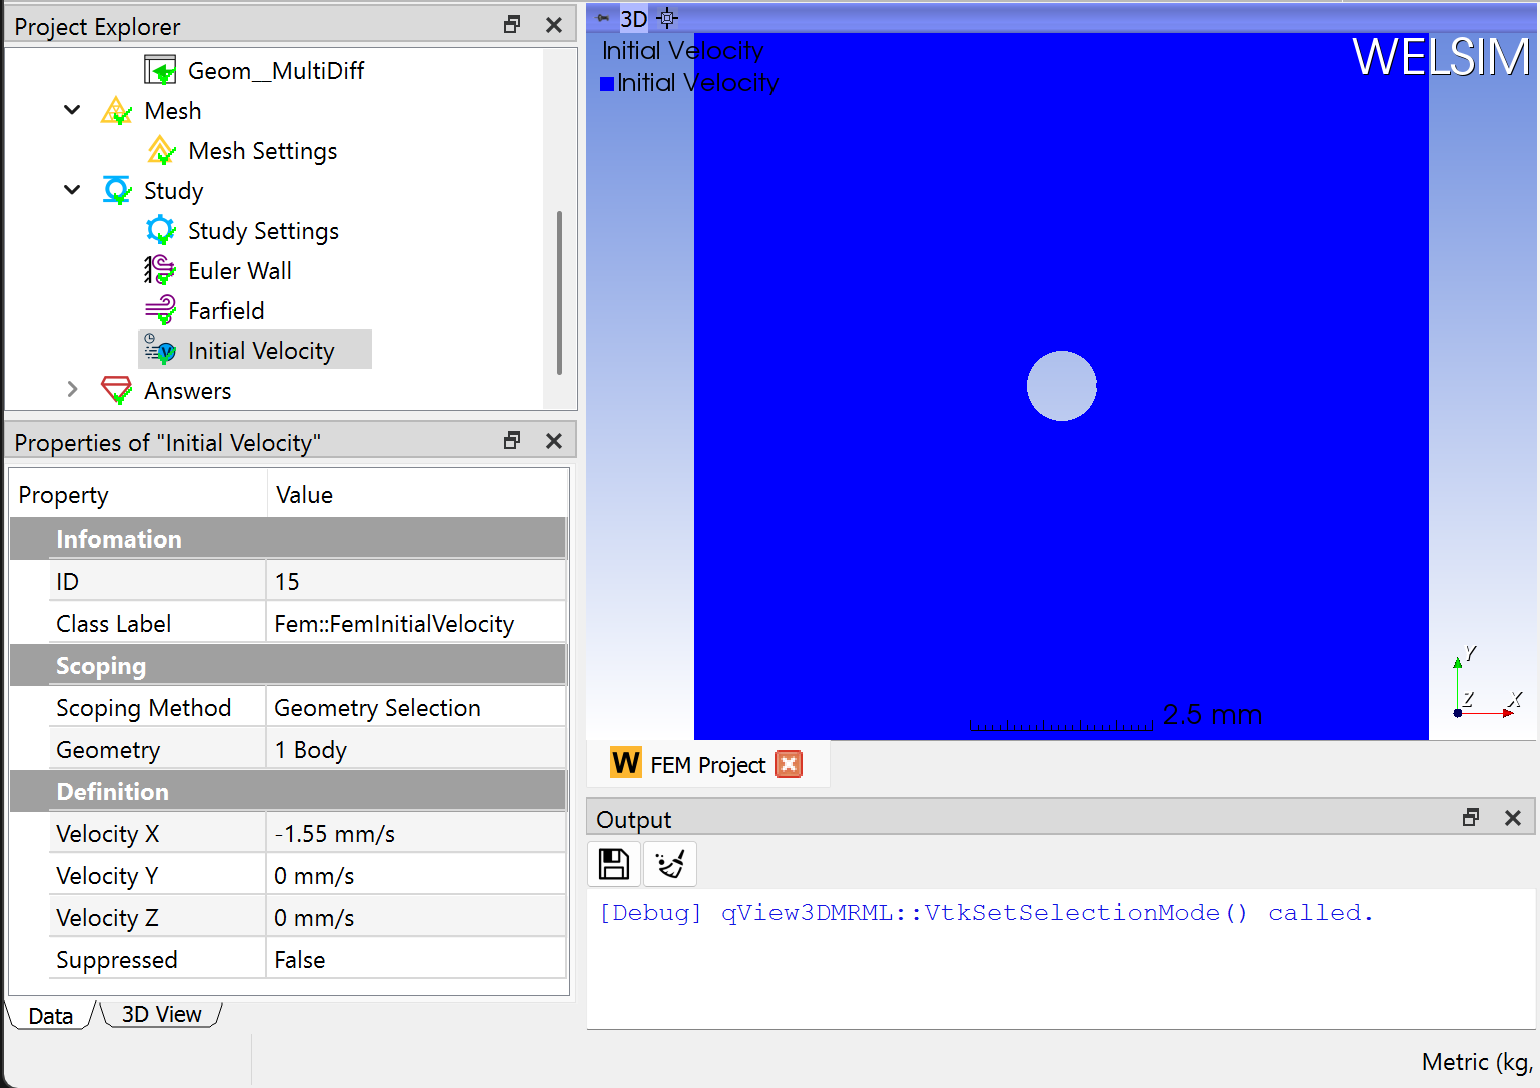
Then, you impose an initial velocity condition, scope the entire domain for it, and set the velocity on the X direction is -1.55 m/s.
Solving the model
To solve the model, you can click the Compute command from the Toolbar, FEM Menu, or right-click on the Answers object and select Compute command from context menu. Depending on the complexity of the model, the solving process can be completed in seconds to hours. The Output window displays the solver messages and indicates the status of the solving process.
Evaluating results
To evaluate the pressure of the domain, you can add a Pressure result object to the tree by clicking the Pressure item from the Toolbar, Fluids Menu. Next, double-clicking the result object or clicking the Evaluate item from the Toolbar or FEM Menu, you display the contour in the Graphics window as shown in Figure below.
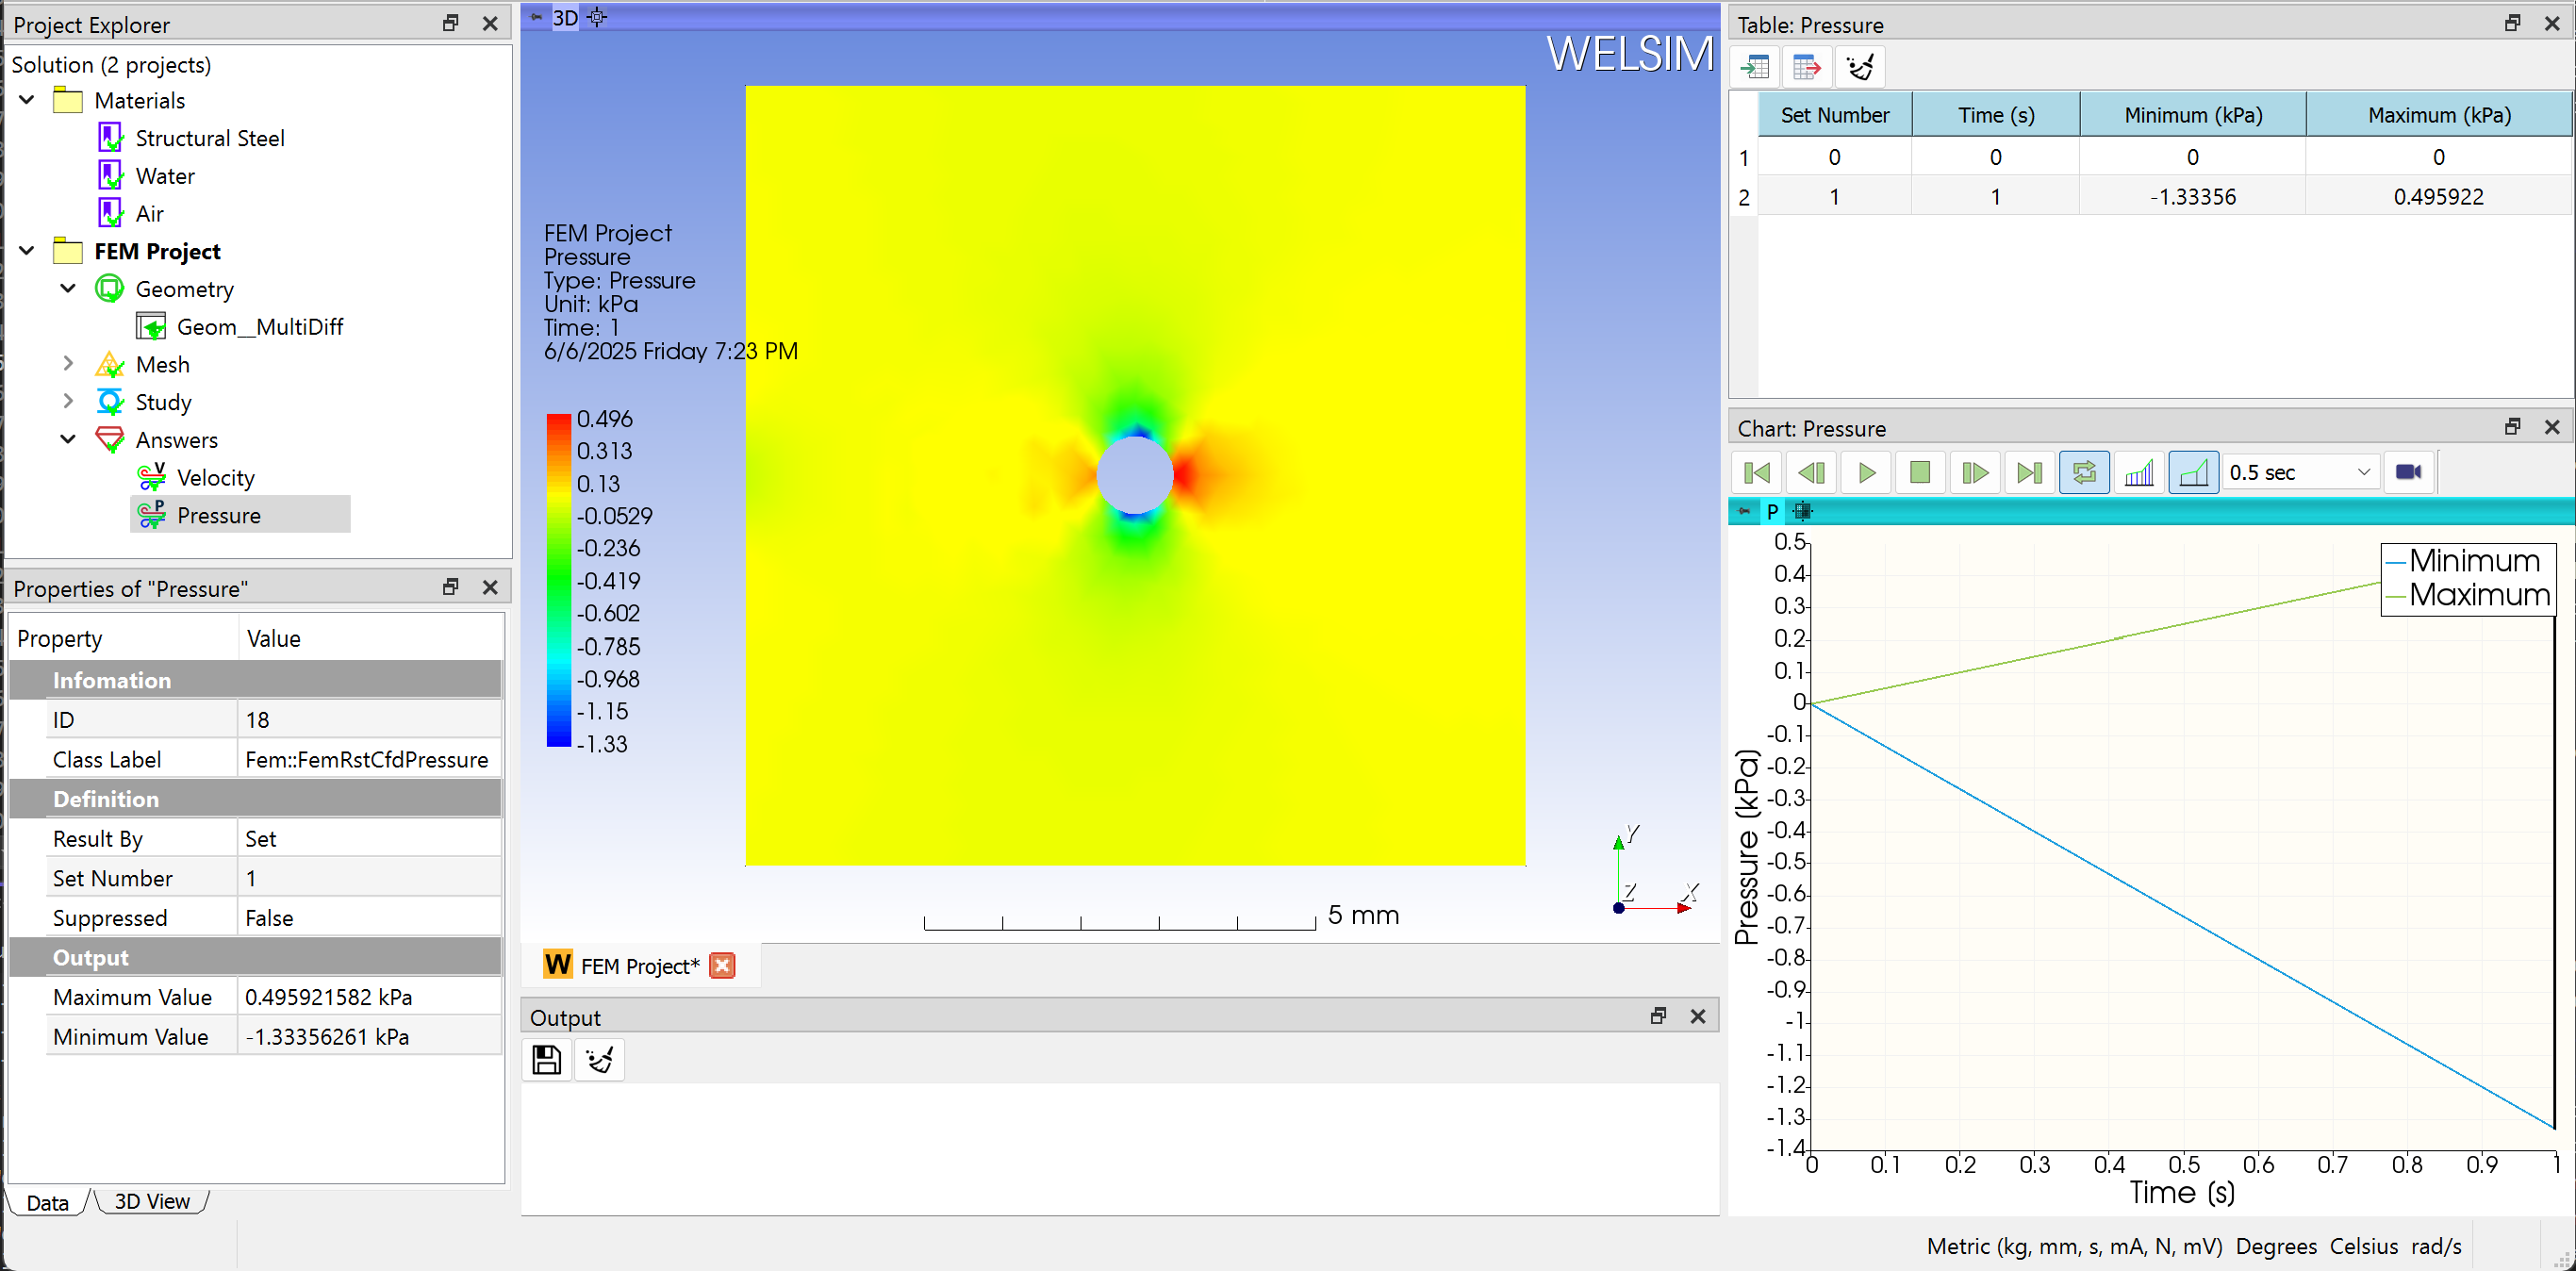
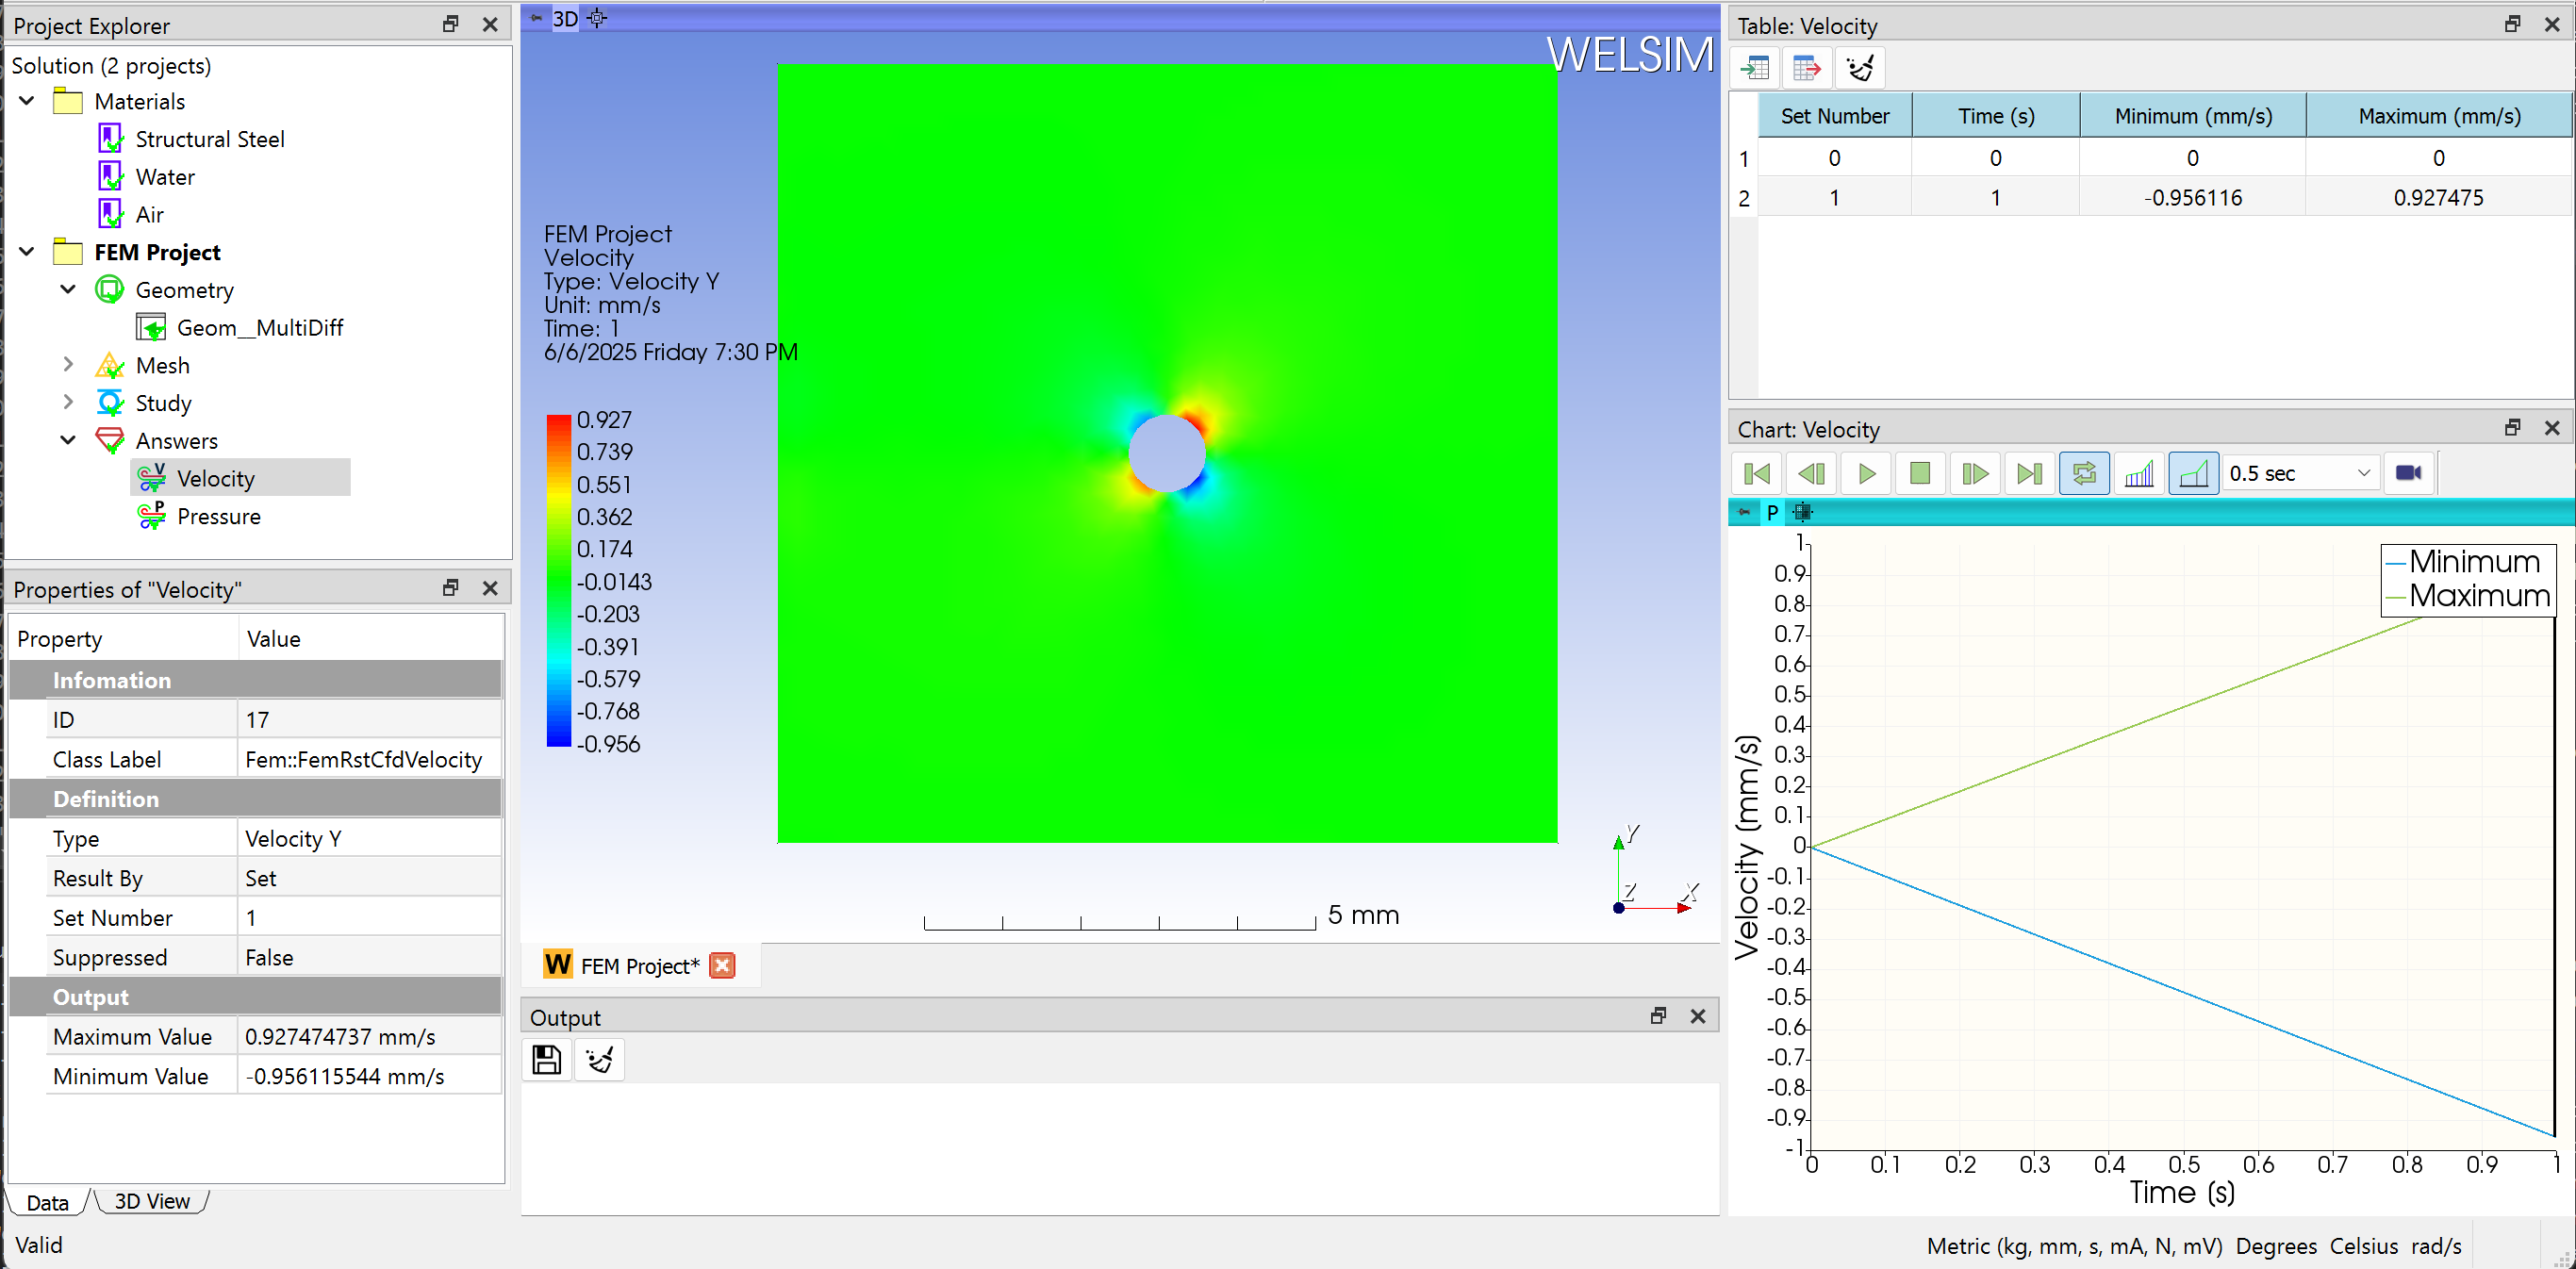
Adding a velocity result object is similar. Clicking the Velocity result from Toolbar or Fluids Menu, you insert a Velocity result object to the tree. Evaluating the Velocity Y Type, you obtain the velocity contour on Y direction in the Graphics window. The Maximum and Minimum values of field data are displayed in the Properties View window as shown in Figure below.
