Quick start
This section demonstrates the primary GUI features and workflow in WELSIM.
Graphical user interface
Overview
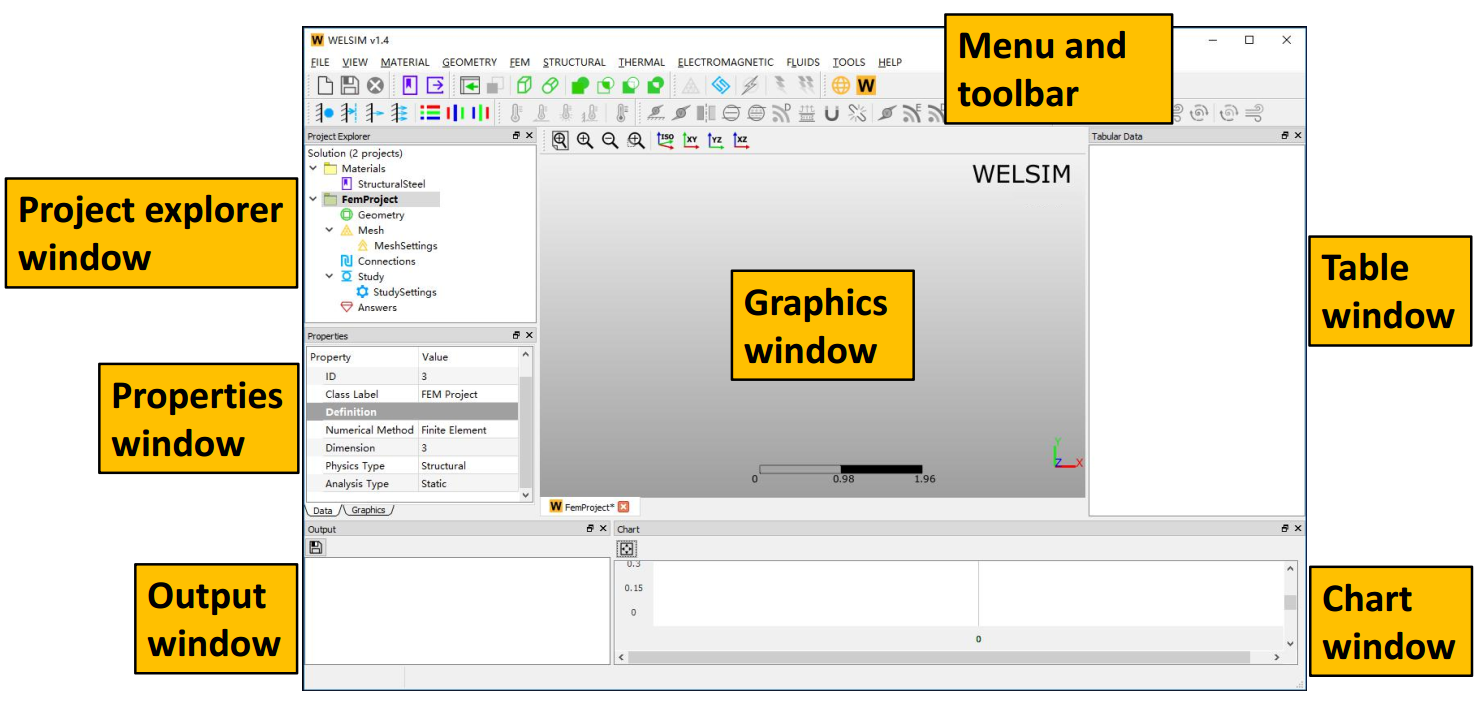
WELSIM provides an intuitive graphical user interface (GUI) to customize the finite element analysis settings. The primary components of the GUI include:
- Menu
- Toolbar
- Project Explorer (Tree) window
- Properties View window
- Graphics window
- Tabular Data window
- Chart window
- Output window
An overview of the GUI is shown in the Figure below.
Menu and Toolbar
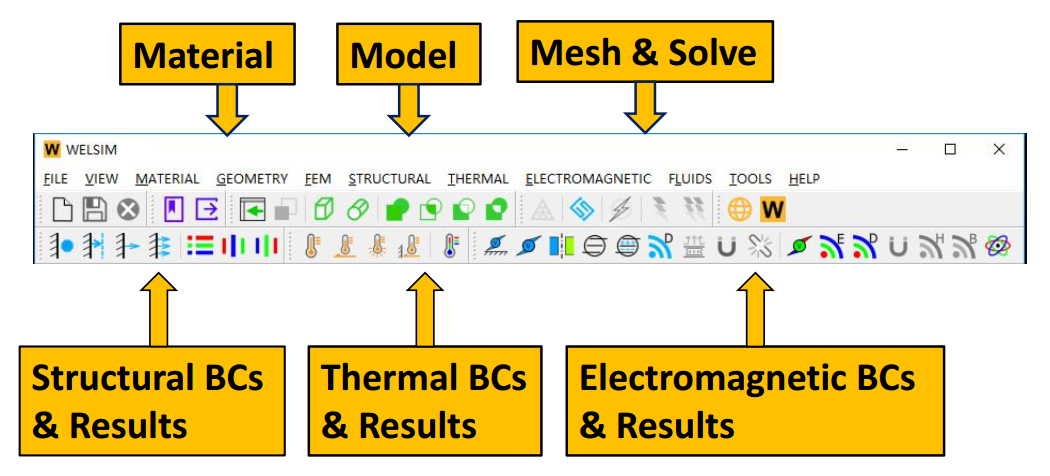
The Menu and Toolbar contain the primary commands of the application as shown below. Sections Main Menus and Toolbars have more details.
Graphics window
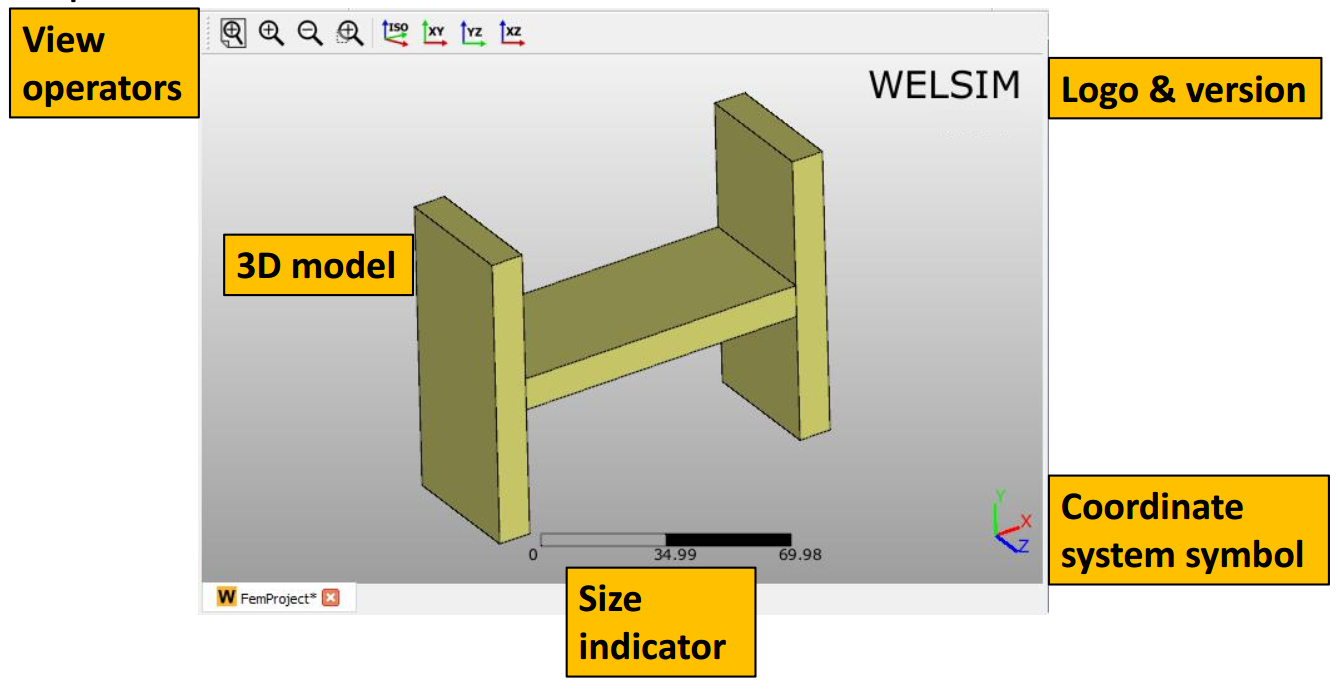
The Graphics window displays the geometries with the associated symbols, text, and annotations. In this window, you can pan, rotate, and zoom to better see the 3D geometries. In addition to the geometries, this window may contain annotation, Graphics Toolbar, coordinate system symbol, ruler, logo, etc. A schematic view of the Graphics window is shown below.
Unit definition
The Preferences window lists the available units you can choose. It's usually the first step to start the simulation. 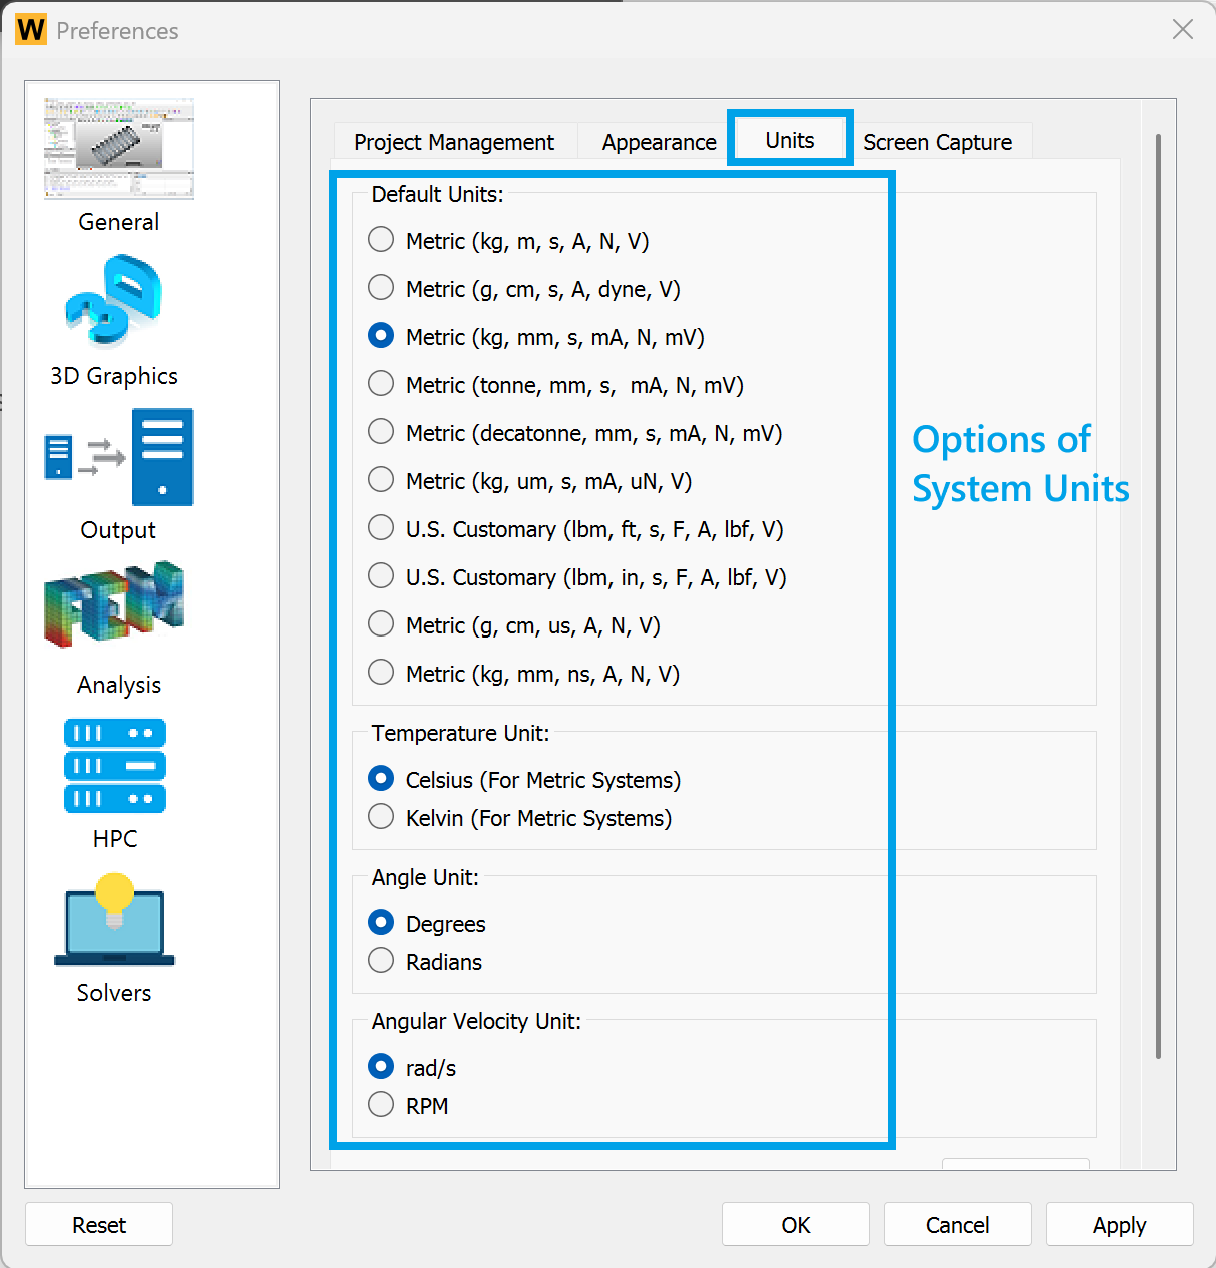
The bottom right of the main window shows the current units in use. 
Material definition spreadsheet
The material module provides a spreadsheet for you to define and review material properties. An overview of the material property spreadsheet is shown below. 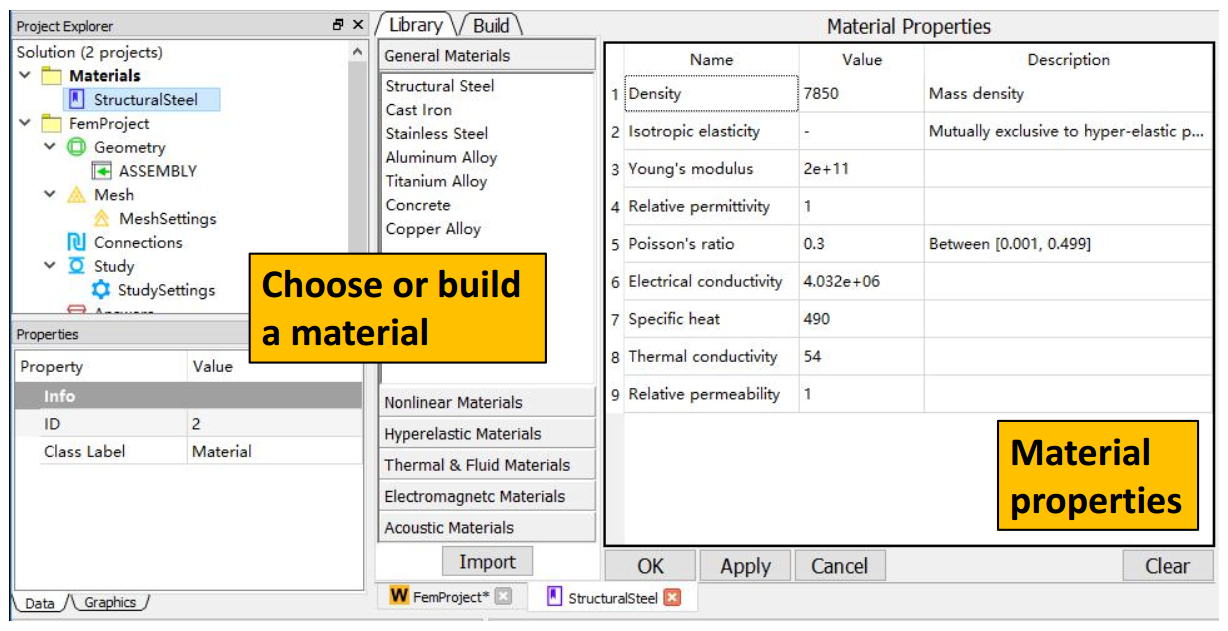
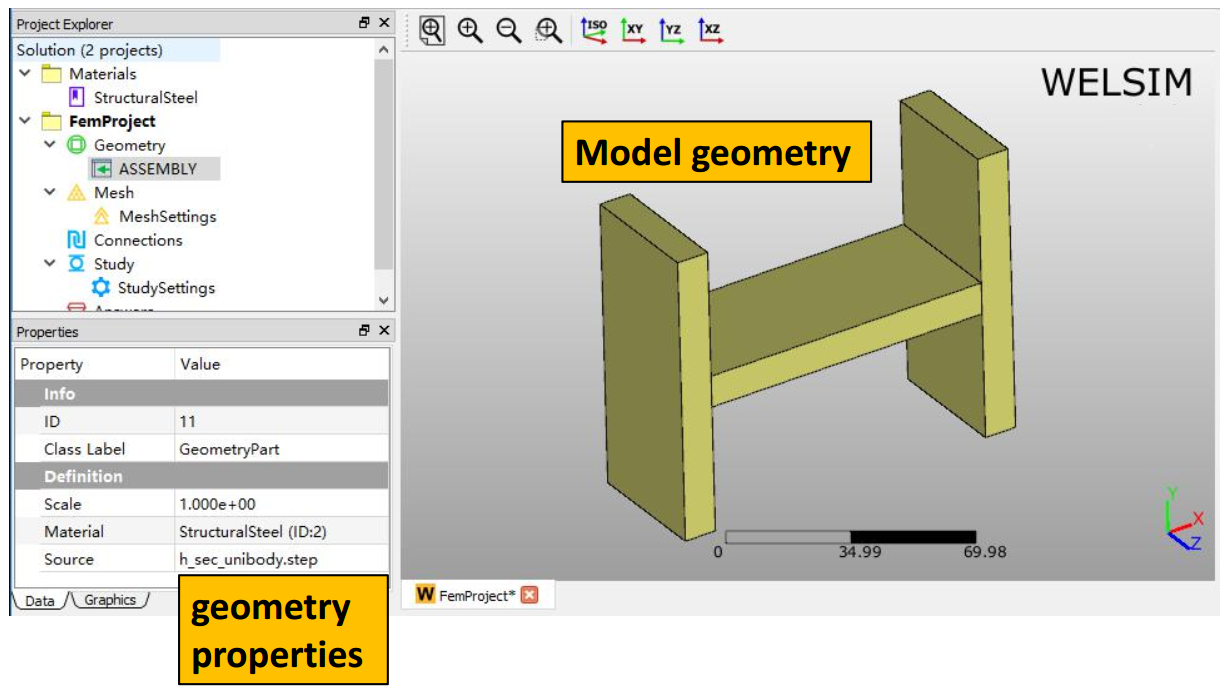
Geometry display
The Graphics window displays the 3D geometries, meshed elements, result contours, etc. A 3D geometry and object properties are shown below.
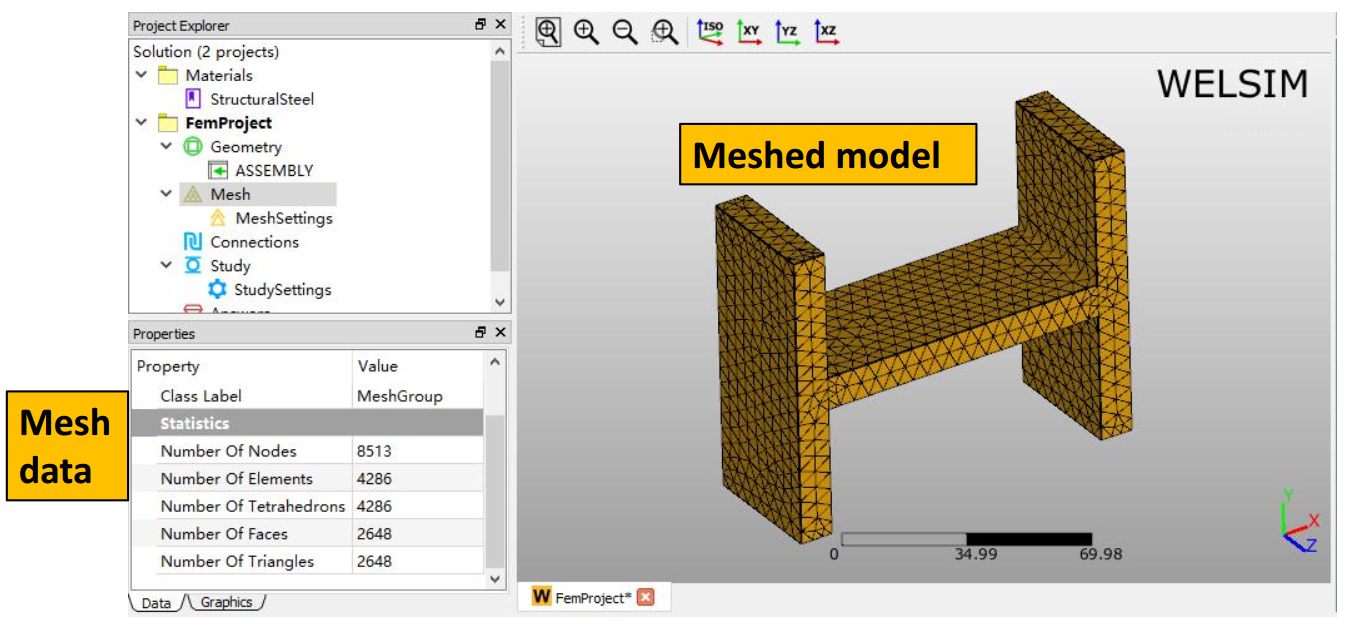
Mesh display
The Graphics window displays the mesh when mesh related objects are selected in the tree. The Properties View shows the statistical data of the mesh as shown below.
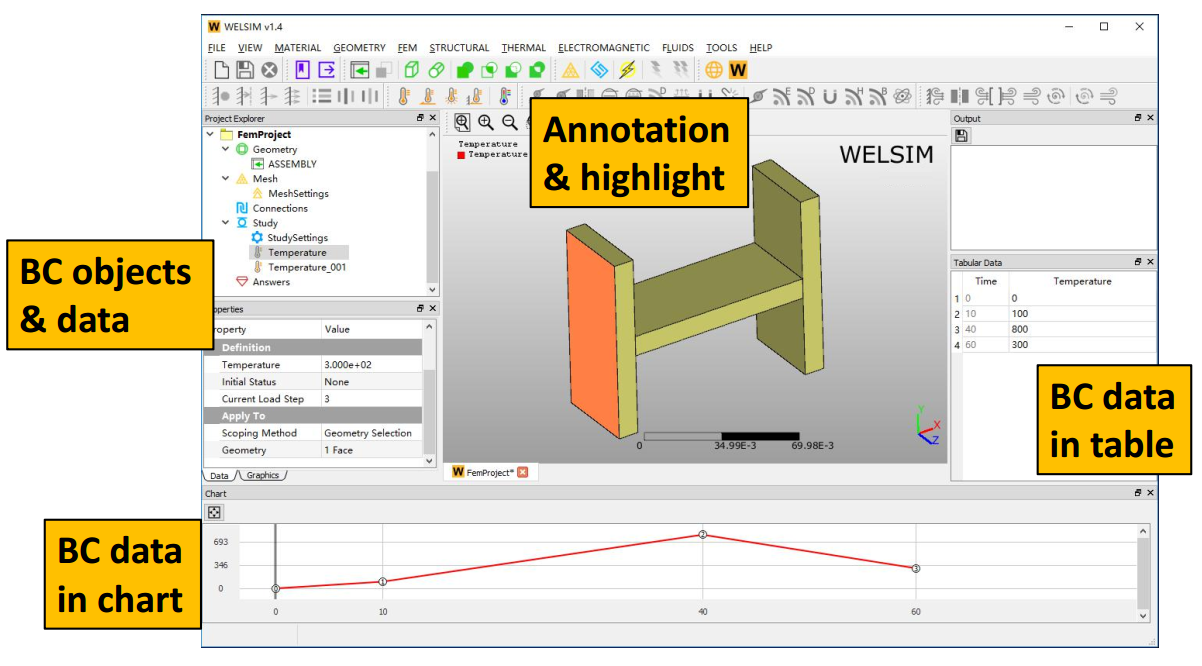
Boundary condition display
For the boundary conditions, the Graphics window displays the highlighted entities (faces, edges, vertices). The Properties View, Tabular Data, and Chart windows show the boundary values over time. Additionally, the Properties View window allows you to scope geometry entities and set values, as shown below.
Solution display
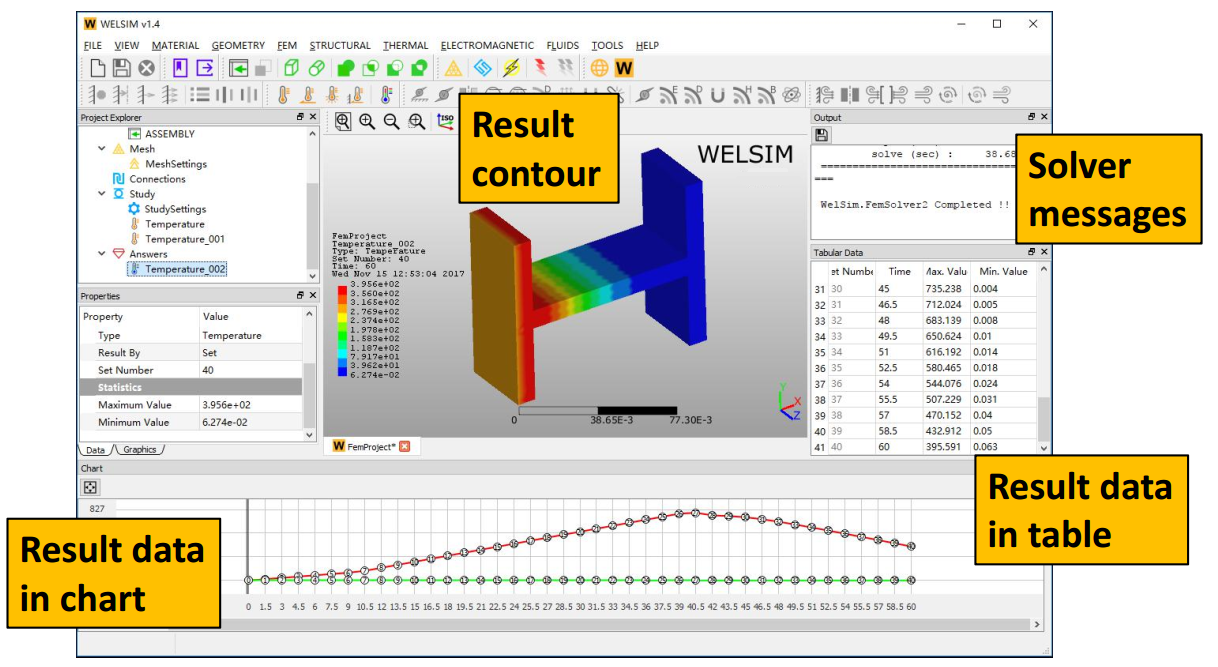
After solving, the user interface displays the solution and results. The Graphics window displays the result contour and legend. The Properties View shows the maximum and minimum values of the result at the given Set Number. The Tabular Data and Chart windows also illustrate the maximum and minimum values over the time, as shown below.
Result legend
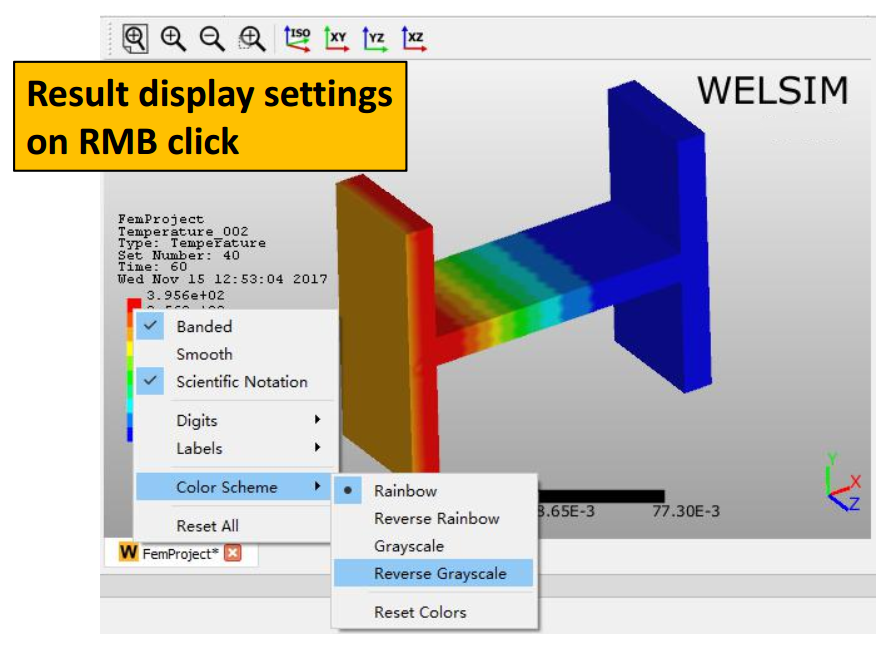
You can adjust the result contour and legend by right-clicking on the legend field; then, setting the parameters in the context menu, as shown below.
Workflow
Using WELSIM is straightforward. The following gives you the primary workflow steps to start a finite element analysis project from scratch:
Choosing unit
In the preferences, select an appropriate unit system for the entire simulation. The currently selected unit is displayed in the lower right corner of the main window.
Creating a new project
Click the New command from the Toolbar or File Menu to create a new simulation project. Several default objects are automatically generated in the tree, and the Graphics window is filled with the 3D modeling interface. The following shows the behaviors of creating a new project:
-
A Material Project and a FEM Project are created simultaneously. The Material Project object holds only Material objects, while the FEM Project object contains all modeling objects used to customize a finite element analysis. Only one Material Project is allowed in the tree, but you can have multiple FEM Projects to conduct different simulation studies in one interface.
-
An activated project will display the object name in Bold. Double click the project object to activate a FEM Project.
-
Commands on the Toolbar and Menu will become available as the FEM project is created.
-
Each object has a unique context menu. To display the context menu, you can right-click. For example, you can use the context menu to rename an object.
-
Each object allows for unique customizations in the Properties View window, which automatically updates as you select objects.
Defining materials
In addition to the default Structural Steel material, you can add new materials and its property definitions. A Material object represents a material database. The following gives the behaviors of material definition.
-
Create a new material object by clicking Add Material from the Toolbar or Material Menu. The Material Project can hold multiple Material objects.
-
A newly created Material object requires you to specify its properties. Double-click or right-click on the material object to open the Edit spreadsheet.
-
There are two methods to add material properties in the Edit spreadsheet. The Library tab provides pre-defined material data, able to be directly imported. The Build tab lists all available properties, so you can set properties one by one.
Importing or creating geometries
You can add geometry data by importing a CAD file or by creating primitive shapes using commands from the Toolbar or Geometry Menu.
- The built-in modeler allows you to create primitive shapes, such as a Box, Cylinder, Plate, and Line.
- The supported CAD geometry file formats are: STEP, IGES.
- The ruler in the Graphics window provides a reference to estimate the size of geometries.
- The size of the imported geometry can be adjusted by tuning the Scale property value.
Meshing
You could skip meshing at this moment because WELSIM automatically meshes the domain at solving step if no mesh is generated. However, meshing at this step provides insight on the mesh quality, and gives you a chance to optimize the mesh. To perform the meshing operations, click the Mesh commands from the Toolbar or FEM Menu .
- The mesh module supports Tet10, Tet4, Tri6, and Tri3 elements. The default type is the linear element, but you can change the element order by modifying the Quadratic property in Mesh Settings object.
- For multiple body geometries, you can add a Mesh Method object to make some bodies have a different mesh density from the global mesh density, which is defined in Mesh Settings.
- The Toolbar and FEM Menu provides mesh tools, such as Clear Generated Mesh, Examine Mesh.
- The mesh density can be adjusted by tuning the properties in Mesh Settings, such as Maximum Size, Mesh Density.
Analysis settings
You can define the analysis settings in the following order:
- Set the Physics Type and Analysis Type in the FEM Project object.
- Define the Number of Steps, Current Step, and Current End Time properties in Study object.
- Define analysis settings in Study Settings object.
- Choose the solver, such as CalculiX, Elmer FEM, FrontISTR, LAMMPS, MFEM, OpenRadioss, Palace, SU21. Keeping it Program Controlled allows WELSIM to choose the default solver.
- Define solver settings in the Answers object.
Imposing initial conditions
For the transient analysis, you can define initial conditions. The available initial conditions are
- Initial Temperature
Imposing boundary conditions
Boundary and body conditions are essential for the conducted analysis. Depending on the Physics Type and Analysis Type, various condition objects can be inserted into the tree via the Toolbar or Menu. Below explains the behaviors of the body and boundary conditions.
- The body and boundary condition value is Step-based.
- Multiple boundary and body conditions can be jointly imposed on the geometry.
- In the condition scoping, you can select multiple entities by pressing the Ctrl or Shift key. However, the entities for one property field must be the same type of geometry.
- The Graphics window displays the annotation and highlighted geometry entities if a condition object is valid.
- The Tabular Data and Chart windows can show the condition values over time.
Solve
To solve the customized model, click the Compute command from the Toolbar or FEM Menu. The behaviors of solving are as follows.
- You may be required to Save the project before solving. The system needs to save the input scripts and mesh data for the solvers.
- The Output window will display solver messages. The message will indicate the success or failure of the solving process.
- You can discontinue the solving process by clicking the Stop Interprocess button in the Output panel.
Displaying results
Depending on the Physics Type and Analysis Type, various result objects can be inserted into the tree via the Toolbar or Menu. Below gives the behaviors of the solution and results.
- To display the resulting contour, select the target result object and click Evaluate on the Toolbar or FEM Menu, or double click the object.
- You can adjust the contour format by right-clicking on the resulting legend.
- You can clear result contour by clicking Clear Result, or Clear Calculated Solution commands from the Toolbar or FEM Menu.
Completed
The analysis is completed. You can Save the projects to an external “wsdb” file and close WELSIM.
Note
The *.wsdb file and associated folder are the WELSIM database for project data persistence. You can open this project file later, on another computer, and on different operating systems.
-
WELSIM is not affilicated with the open source solvers CalculiX, Elmer FEM, FrontISTR, LAMMPS, MFEM, OpenRadioss, Palace, and SU2. ↩